Cloud monitoring and observability tools have become the backbone of modern cloud operations, ensuring that applications behave reliably and deliver consistent performance even in highly dynamic environments. As organizations adopt microservices, container orchestration, serverless functions, and multi-cloud deployments, the number of moving components within systems has increased drastically. Traditional monitoring tools, which only track basic metrics such as CPU usage or uptime, fall short in identifying deeper issues across distributed systems. Observability enhances this by allowing teams to understand not only what is happening but also why it is happening. This shift toward deeper visibility is crucial because cloud environments behave differently every second as services scale up, scale down, failover, or redirect traffic.
The difference between monitoring and observability is foundational. Monitoring focuses on predefined metrics and dashboards that help answer the question, “Is the system healthy?” whereas observability answers, “Why did something break?” or “Where is the root cause?” Observability embraces unpredictability by allowing engineers to explore unknown issues rather than relying only on predefined alerts. With systems communicating through APIs, queues, and event streams, observability helps teams discover bottlenecks in workflows, identify service dependencies, and diagnose latency spikes. This makes observability a necessity, not an option, for any cloud-native system.
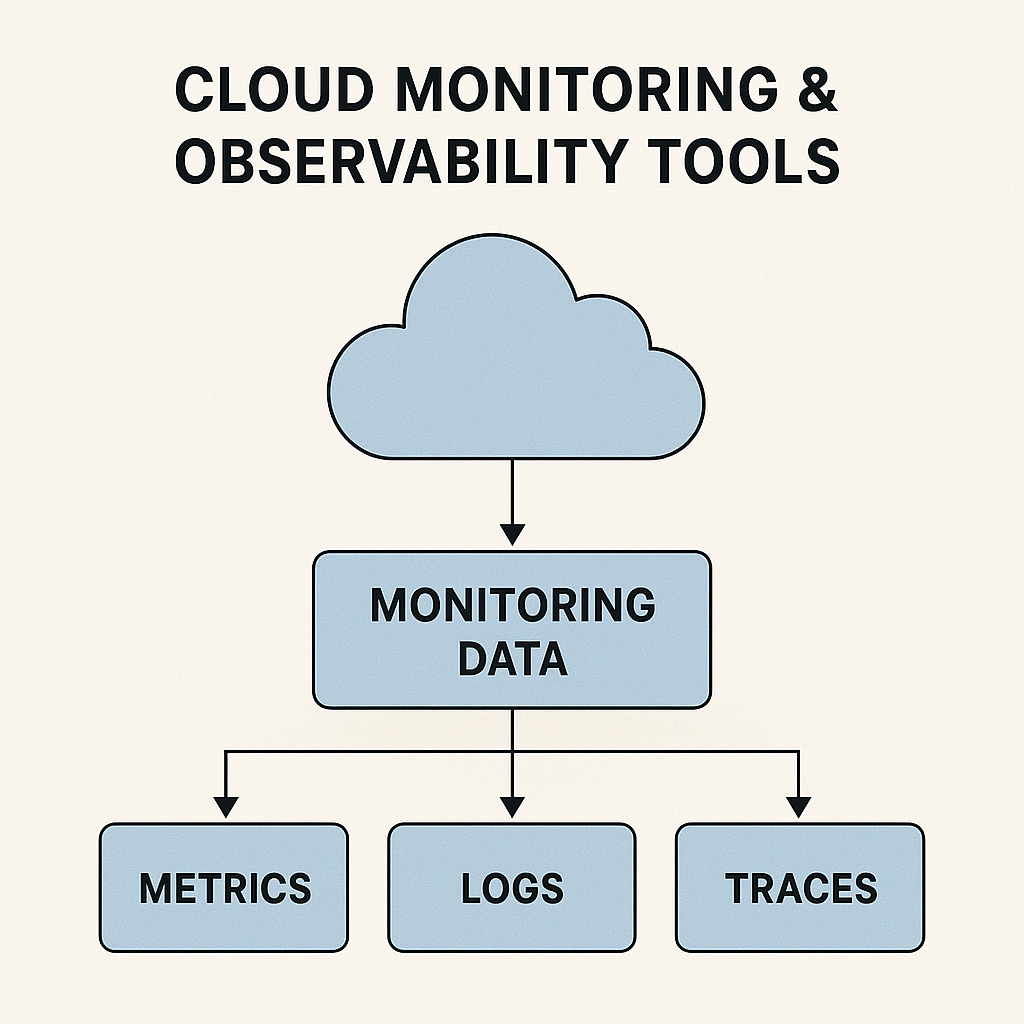
Observability is built on three core pillars: metrics, logs, and traces. Metrics provide numerical insights like request rates, latency, memory utilization, or error percentages. Logs provide contextual details, recording exact events that occurred within applications or infrastructure. Traces reveal the entire journey of a request traveling through multiple microservices. Together, these pillars enable teams to reconstruct events with precision and discover root causes much faster than traditional monitoring. As systems grow into hundreds of microservices, traces become especially critical for identifying slow components, failed requests, or inefficient service paths.
Today’s cloud ecosystem offers a rich set of monitoring and observability tools. Prometheus is widely used for time-series data collection in Kubernetes-based systems, while Grafana offers powerful data visualization through dynamic dashboards. Datadog and New Relic provide full-stack observability, combining logs, metrics, and traces into a unified platform with advanced AI-based insights. AWS CloudWatch, Google Cloud Operations Suite, and Azure Monitor offer deep integration with their respective cloud environments, providing native monitoring for compute, storage, networking, databases, and serverless components. Tools like Jaeger and Zipkin specialize in distributed tracing, enabling teams to analyze microservice-based architectures with ease. Each of these tools plays a unique role in helping organizations maintain performance, security, and stability across their cloud environments.
The workflow of cloud monitoring and observability involves several stages. Data is first collected from application components, infrastructure nodes, APIs, and network resources using agents or exporters. This raw telemetry is then processed, structured, and stored in specialized systems designed for logs or time-series data. Observability platforms analyze these data streams using machine learning to detect anomalies, performance degradation, or unusual traffic patterns. Engineers can explore dashboards that visualize service health or investigate issues using logs and traces. Alerts notify teams in real-time about potential failures or threshold breaches, allowing for quick action. Finally, insights derived from observability help teams implement optimizations, improve architecture design, and plan capacity upgrades more intelligently.
Cloud monitoring has become mission-critical in today’s digital world because uptime and performance directly impact user experience, revenue, and brand reputation. A slow-loading page, a failing API, or a memory leak in a microservice can disrupt entire systems. Monitoring identifies such issues early, allowing teams to take preventive action. It also provides better resource utilization by identifying over-provisioned or under-provisioned components. This helps companies reduce operational costs while maintaining high performance. In addition, monitoring ensures compliance with industry standards and SLAs by offering detailed reports on system health and reliability.
Modern observability tools offer a wide range of advanced benefits. Real-time anomaly detection helps teams identify unusual spikes in resource usage, error rates, or traffic patterns. AI-powered root cause analysis reduces the time spent investigating complex issues. Distributed tracing allows engineers to pinpoint slow services or malfunctioning components in multi-service architectures. Historical analytics provide long-term insights for capacity planning and architectural improvements. Shared dashboards improve collaboration between DevOps, engineering, SRE, and security teams, ensuring transparency across the organization. Together, these benefits elevate system reliability and reduce mean time to resolution (MTTR).
However, implementing cloud monitoring and observability also introduces challenges. The volume of logs, metrics, and traces generated by cloud-native systems can be overwhelming, leading to high storage and processing costs. Multi-cloud environments add complexity, requiring integration of data across AWS, Azure, Google Cloud, and on-premise systems. Alert fatigue is another common issue, where teams receive too many alerts, making it difficult to identify truly critical incidents. Adopting observability requires a skilled engineering team capable of analyzing and correlating telemetry data effectively. Organizations also need strong governance models to ensure sensitive data in logs remains secure and compliant with regulations.
The future of cloud observability is evolving rapidly with the rise of AI, automation, and autonomous cloud operations. Upcoming trends include predictive monitoring powered by machine learning, where systems forecast failures before they occur. Automated remediation will allow cloud platforms to fix issues without human intervention—such as restarting unhealthy pods or scaling resources automatically. Unified observability platforms will combine performance, security, user experience, and business analytics into a single interface. Serverless and edge environments will drive new innovations in lightweight telemetry collection. Standards like OpenTelemetry will make cross-platform observability simpler and more consistent. As cloud infrastructure grows more complex, observability will become essential for every digital business.
The difference between monitoring and observability is foundational. Monitoring focuses on predefined metrics and dashboards that help answer the question, “Is the system healthy?” whereas observability answers, “Why did something break?” or “Where is the root cause?” Observability embraces unpredictability by allowing engineers to explore unknown issues rather than relying only on predefined alerts. With systems communicating through APIs, queues, and event streams, observability helps teams discover bottlenecks in workflows, identify service dependencies, and diagnose latency spikes. This makes observability a necessity, not an option, for any cloud-native system.
Observability is built on three core pillars: metrics, logs, and traces. Metrics provide numerical insights like request rates, latency, memory utilization, or error percentages. Logs provide contextual details, recording exact events that occurred within applications or infrastructure. Traces reveal the entire journey of a request traveling through multiple microservices. Together, these pillars enable teams to reconstruct events with precision and discover root causes much faster than traditional monitoring. As systems grow into hundreds of microservices, traces become especially critical for identifying slow components, failed requests, or inefficient service paths.
Today’s cloud ecosystem offers a rich set of monitoring and observability tools. Prometheus is widely used for time-series data collection in Kubernetes-based systems, while Grafana offers powerful data visualization through dynamic dashboards. Datadog and New Relic provide full-stack observability, combining logs, metrics, and traces into a unified platform with advanced AI-based insights. AWS CloudWatch, Google Cloud Operations Suite, and Azure Monitor offer deep integration with their respective cloud environments, providing native monitoring for compute, storage, networking, databases, and serverless components. Tools like Jaeger and Zipkin specialize in distributed tracing, enabling teams to analyze microservice-based architectures with ease. Each of these tools plays a unique role in helping organizations maintain performance, security, and stability across their cloud environments.
The workflow of cloud monitoring and observability involves several stages. Data is first collected from application components, infrastructure nodes, APIs, and network resources using agents or exporters. This raw telemetry is then processed, structured, and stored in specialized systems designed for logs or time-series data. Observability platforms analyze these data streams using machine learning to detect anomalies, performance degradation, or unusual traffic patterns. Engineers can explore dashboards that visualize service health or investigate issues using logs and traces. Alerts notify teams in real-time about potential failures or threshold breaches, allowing for quick action. Finally, insights derived from observability help teams implement optimizations, improve architecture design, and plan capacity upgrades more intelligently.
Cloud monitoring has become mission-critical in today’s digital world because uptime and performance directly impact user experience, revenue, and brand reputation. A slow-loading page, a failing API, or a memory leak in a microservice can disrupt entire systems. Monitoring identifies such issues early, allowing teams to take preventive action. It also provides better resource utilization by identifying over-provisioned or under-provisioned components. This helps companies reduce operational costs while maintaining high performance. In addition, monitoring ensures compliance with industry standards and SLAs by offering detailed reports on system health and reliability.
Modern observability tools offer a wide range of advanced benefits. Real-time anomaly detection helps teams identify unusual spikes in resource usage, error rates, or traffic patterns. AI-powered root cause analysis reduces the time spent investigating complex issues. Distributed tracing allows engineers to pinpoint slow services or malfunctioning components in multi-service architectures. Historical analytics provide long-term insights for capacity planning and architectural improvements. Shared dashboards improve collaboration between DevOps, engineering, SRE, and security teams, ensuring transparency across the organization. Together, these benefits elevate system reliability and reduce mean time to resolution (MTTR).
However, implementing cloud monitoring and observability also introduces challenges. The volume of logs, metrics, and traces generated by cloud-native systems can be overwhelming, leading to high storage and processing costs. Multi-cloud environments add complexity, requiring integration of data across AWS, Azure, Google Cloud, and on-premise systems. Alert fatigue is another common issue, where teams receive too many alerts, making it difficult to identify truly critical incidents. Adopting observability requires a skilled engineering team capable of analyzing and correlating telemetry data effectively. Organizations also need strong governance models to ensure sensitive data in logs remains secure and compliant with regulations.
The future of cloud observability is evolving rapidly with the rise of AI, automation, and autonomous cloud operations. Upcoming trends include predictive monitoring powered by machine learning, where systems forecast failures before they occur. Automated remediation will allow cloud platforms to fix issues without human intervention—such as restarting unhealthy pods or scaling resources automatically. Unified observability platforms will combine performance, security, user experience, and business analytics into a single interface. Serverless and edge environments will drive new innovations in lightweight telemetry collection. Standards like OpenTelemetry will make cross-platform observability simpler and more consistent. As cloud infrastructure grows more complex, observability will become essential for every digital business.