Browser Developer Tools, commonly known as DevTools, are built-in toolsets available in modern browsers such as Google Chrome, Firefox, Edge, and Safari. These tools empower developers to inspect, debug, and optimize websites directly from the browser environment. DevTools provide deep insights into how web pages work behind the scenes—covering HTML, CSS, JavaScript, network activity, rendering performance, memory usage, application storage, and security. For both beginners and experienced developers, DevTools serve as the foundation for debugging issues, improving website speed, fixing layout problems, and testing how a site behaves across various devices and conditions. Understanding how to use DevTools efficiently is essential for creating polished, high-performance web applications.
One of the most frequently used features of DevTools is the Elements panel (Chrome) or Inspector panel (Firefox). It displays the Document Object Model (DOM) and the associated CSS styles. Developers can click on any element on a webpage to see its HTML structure, live CSS, box model details, and applied/overridden styles. This is extremely helpful for identifying layout issues, fixing CSS conflicts, and tweaking visual styles on the spot. The ability to edit HTML or CSS in real-time makes the debugging process faster, more interactive, and easier to visualize. Many developers use this feature to experiment with layout changes before writing the final code in their editor.
The Console panel is where developers debug JavaScript by viewing logs, errors, warnings, and runtime messages. It also allows running custom JS commands directly in the browser. This feature is particularly useful for testing logic, verifying variables, inspecting objects, or fixing errors without refreshing the page. The Console helps identify broken scripts, syntax errors, failed API calls, undefined variables, and unexpected behavior. Developers can also set breakpoints, view stack traces, and step through code execution using the Sources panel, making DevTools a full-featured debugging environment. For frontend development, this debugging capability is a tremendous time-saver.
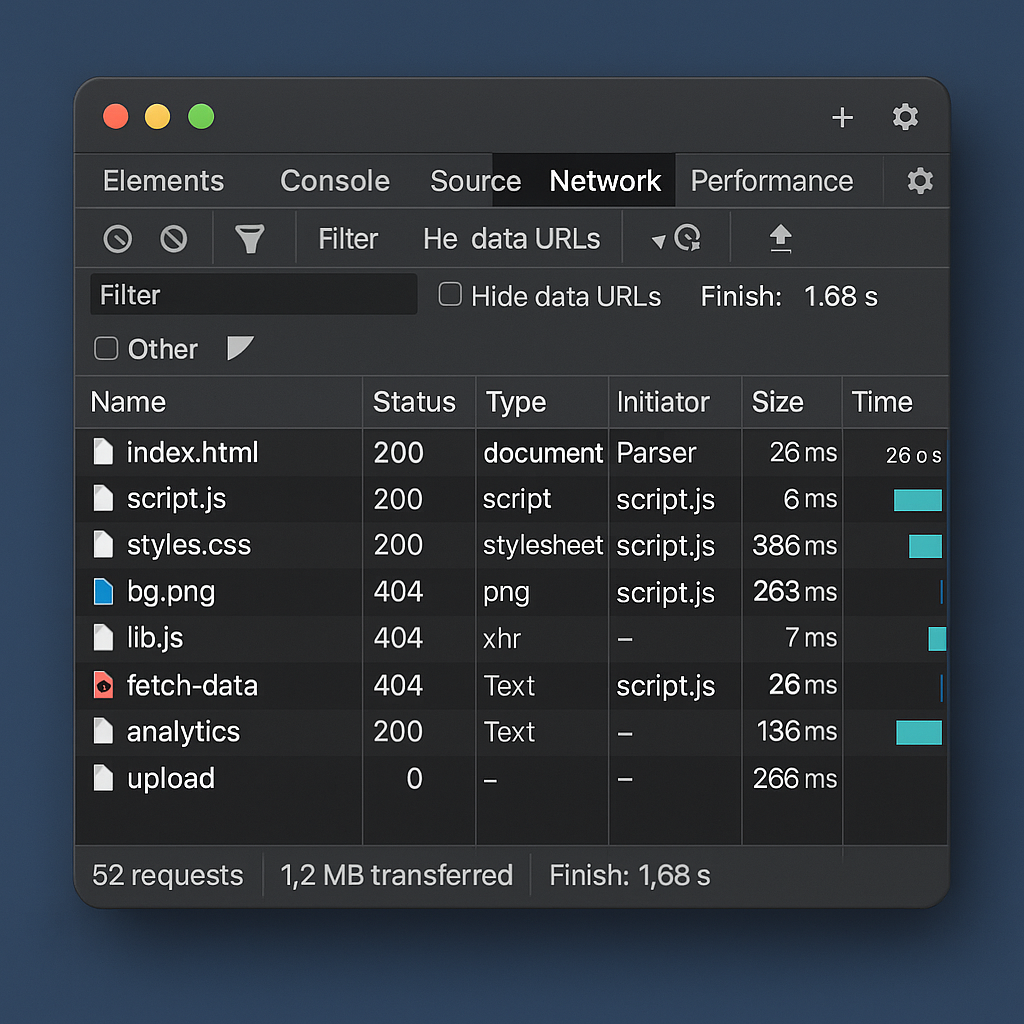
The Network panel reveals all network activity—from images and scripts to API calls and resources loaded during page rendering. Developers can analyze request timings, response sizes, HTTP status codes, caching behavior, and load order. This helps pinpoint slow APIs, large files, redundant requests, and server-side errors. The waterfall chart offers a visual breakdown of how long everything takes to load, helping developers optimize speed. Tools like throttling allow simulation of slow networks (3G/4G), helping test performance under real-world conditions. Understanding this panel is vital for optimizing page load time and ensuring smooth user experience.
The Performance panel is essential for diagnosing slowness, lag, or janky animations. It records a timeline that shows CPU usage, frames per second (FPS), layout shifts, paint operations, and script execution. Developers can see which processes take the most time and identify memory leaks, heavy scripts, or inefficient rendering patterns. This panel helps optimize animations, reduce layout thrashing, and ensure the website maintains 60 FPS for smooth interactions. Performance profiling is especially important in modern web apps, where heavy UI frameworks and animations can slow down the user experience.
Modern websites use several storage systems such as LocalStorage, SessionStorage, IndexedDB, cookies, and cache. The Application panel allows developers to inspect all of these. They can modify, clear, or delete stored data instantly, which is especially helpful when debugging login states, cart items, or offline-capable web apps. DevTools also shows details about service workers, manifest files, cached assets, and Progressive Web App (PWA) settings. This panel is crucial for developers building apps with offline support, background sync, and advanced storage management.
One of the most useful features of DevTools is Device Mode, which simulates multiple screen sizes and mobile behaviors. Developers can test how websites look on different devices like iPhone, Pixel, iPad, Galaxy phones, and even custom viewports. It also simulates mobile touch input, screen rotation, network throttling, and CPU throttling. Device Mode ensures that responsive designs work perfectly across various resolutions. Instead of checking on physical devices, developers can quickly preview layouts, media queries, font scaling, and touch interactions right inside DevTools.
DevTools include advanced panels for security, accessibility, and SEO optimization. The Security panel shows certificate information, mixed content warnings, and HTTPS issues. Lighthouse, an automated auditing tool, generates scores for performance, accessibility, best practices, and SEO—suggesting improvements for each. The Accessibility checker allows viewing ARIA attributes, color contrast ratios, and keyboard navigation issues. These tools ensure that websites are safe, inclusive, fast, and search-engine friendly. They also help developers follow modern web standards and improve overall user satisfaction.
Browser DevTools remain one of the most powerful tools in every web developer’s toolkit. They simplify debugging, help visualize page structure, reveal performance bottlenecks, and allow real-time experimentation. Whether you’re fixing JavaScript errors, optimizing load times, designing responsive layouts, or inspecting application storage, DevTools provide the control and insight needed to build high-quality web experiences. By mastering DevTools, developers can significantly speed up their workflow, identify hidden problems early, and produce more polished outcomes. As browsers evolve, DevTools continue to expand with new features that support modern development needs—making them indispensable for both beginners and professionals.
One of the most frequently used features of DevTools is the Elements panel (Chrome) or Inspector panel (Firefox). It displays the Document Object Model (DOM) and the associated CSS styles. Developers can click on any element on a webpage to see its HTML structure, live CSS, box model details, and applied/overridden styles. This is extremely helpful for identifying layout issues, fixing CSS conflicts, and tweaking visual styles on the spot. The ability to edit HTML or CSS in real-time makes the debugging process faster, more interactive, and easier to visualize. Many developers use this feature to experiment with layout changes before writing the final code in their editor.
The Console panel is where developers debug JavaScript by viewing logs, errors, warnings, and runtime messages. It also allows running custom JS commands directly in the browser. This feature is particularly useful for testing logic, verifying variables, inspecting objects, or fixing errors without refreshing the page. The Console helps identify broken scripts, syntax errors, failed API calls, undefined variables, and unexpected behavior. Developers can also set breakpoints, view stack traces, and step through code execution using the Sources panel, making DevTools a full-featured debugging environment. For frontend development, this debugging capability is a tremendous time-saver.
The Network panel reveals all network activity—from images and scripts to API calls and resources loaded during page rendering. Developers can analyze request timings, response sizes, HTTP status codes, caching behavior, and load order. This helps pinpoint slow APIs, large files, redundant requests, and server-side errors. The waterfall chart offers a visual breakdown of how long everything takes to load, helping developers optimize speed. Tools like throttling allow simulation of slow networks (3G/4G), helping test performance under real-world conditions. Understanding this panel is vital for optimizing page load time and ensuring smooth user experience.
The Performance panel is essential for diagnosing slowness, lag, or janky animations. It records a timeline that shows CPU usage, frames per second (FPS), layout shifts, paint operations, and script execution. Developers can see which processes take the most time and identify memory leaks, heavy scripts, or inefficient rendering patterns. This panel helps optimize animations, reduce layout thrashing, and ensure the website maintains 60 FPS for smooth interactions. Performance profiling is especially important in modern web apps, where heavy UI frameworks and animations can slow down the user experience.
Modern websites use several storage systems such as LocalStorage, SessionStorage, IndexedDB, cookies, and cache. The Application panel allows developers to inspect all of these. They can modify, clear, or delete stored data instantly, which is especially helpful when debugging login states, cart items, or offline-capable web apps. DevTools also shows details about service workers, manifest files, cached assets, and Progressive Web App (PWA) settings. This panel is crucial for developers building apps with offline support, background sync, and advanced storage management.
One of the most useful features of DevTools is Device Mode, which simulates multiple screen sizes and mobile behaviors. Developers can test how websites look on different devices like iPhone, Pixel, iPad, Galaxy phones, and even custom viewports. It also simulates mobile touch input, screen rotation, network throttling, and CPU throttling. Device Mode ensures that responsive designs work perfectly across various resolutions. Instead of checking on physical devices, developers can quickly preview layouts, media queries, font scaling, and touch interactions right inside DevTools.
DevTools include advanced panels for security, accessibility, and SEO optimization. The Security panel shows certificate information, mixed content warnings, and HTTPS issues. Lighthouse, an automated auditing tool, generates scores for performance, accessibility, best practices, and SEO—suggesting improvements for each. The Accessibility checker allows viewing ARIA attributes, color contrast ratios, and keyboard navigation issues. These tools ensure that websites are safe, inclusive, fast, and search-engine friendly. They also help developers follow modern web standards and improve overall user satisfaction.
Browser DevTools remain one of the most powerful tools in every web developer’s toolkit. They simplify debugging, help visualize page structure, reveal performance bottlenecks, and allow real-time experimentation. Whether you’re fixing JavaScript errors, optimizing load times, designing responsive layouts, or inspecting application storage, DevTools provide the control and insight needed to build high-quality web experiences. By mastering DevTools, developers can significantly speed up their workflow, identify hidden problems early, and produce more polished outcomes. As browsers evolve, DevTools continue to expand with new features that support modern development needs—making them indispensable for both beginners and professionals.